Tramatic Brain Injuries

These data are from the #TidyTuesday (24 March 2020) project. Tidy Tuesday is a weekly data project aimed at the R ecosystem. As this project was borne out of the R4DS Online Learning Community and the R for Data Science textbook, an emphasis was placed on understanding how to summarize and arrange data to make meaningful charts with {ggplot2}, {tidyr}, {dplyr}, and other tools in the {tidyverse} ecosystem.
The intent of Tidy Tuesday is to provide a safe and supportive forum for individuals to practice their wrangling and data visualization skills independent of drawing conclusions. While we understand that the two are related, the focus of this practice is purely on building skills with real-world data.
Tramatic Brain Injuries
The data this week comes from the CDC and Veterans Brain Injury Center. Additional stats can be found at CDC.gov.
This data and cleaning script are primarily from scraping tables out of a PDF. This would be a good example of trying to clean and organize tables from PDFs, using the {pdftools} package from ropensci. I have included the PDFs this data was scraped from, and there are lots of examples of potential graphs to recreate or improve upon. Try your hand at improving or otherwise learning how to use packages like {stringr} or {tidyr} to extract data from messy PDF tables.
tbi_age %>%
  group_by(age_group) %>%
  summarize(total = sum(number_est, na.rm = TRUE),
            rate = round(mean(rate_est, na.rm = TRUE), 2)) %>%
  kable() %>%
  kable_styling(bootstrap_options = "striped", full_width = FALSE) %>%
scroll_box(height = "400px")| age_group | total | rate |
|---|---|---|
| 0-4 | 331403 | 92.62 |
| 15-24 | 476652 | 51.64 |
| 25-34 | 319303 | 34.99 |
| 35-44 | 240462 | 28.31 |
| 45-54 | 265417 | 29.13 |
| 5-14 | 348913 | 47.06 |
| 55-64 | 241511 | 28.73 |
| 65-74 | 211035 | 39.98 |
| 75+ | 442377 | 111.54 |
tbi_age %>%
  group_by(age_group) %>%
  summarize(rate = round(mean(rate_est, na.rm = TRUE), 2)) %>%
  mutate(age_group = fct_reorder(age_group, rate)) %>%
  ggplot(aes(age_group, rate, fill = age_group)) +
  geom_col(show.legend = FALSE) +
  scale_fill_grey(start = 0.8, end = 0.3) +
  coord_flip() +
  labs(title = "TBI incident rate by age",
       caption = "Reported in 2014",
       x = NULL,
       y = "TBI incident rate (per 100k)")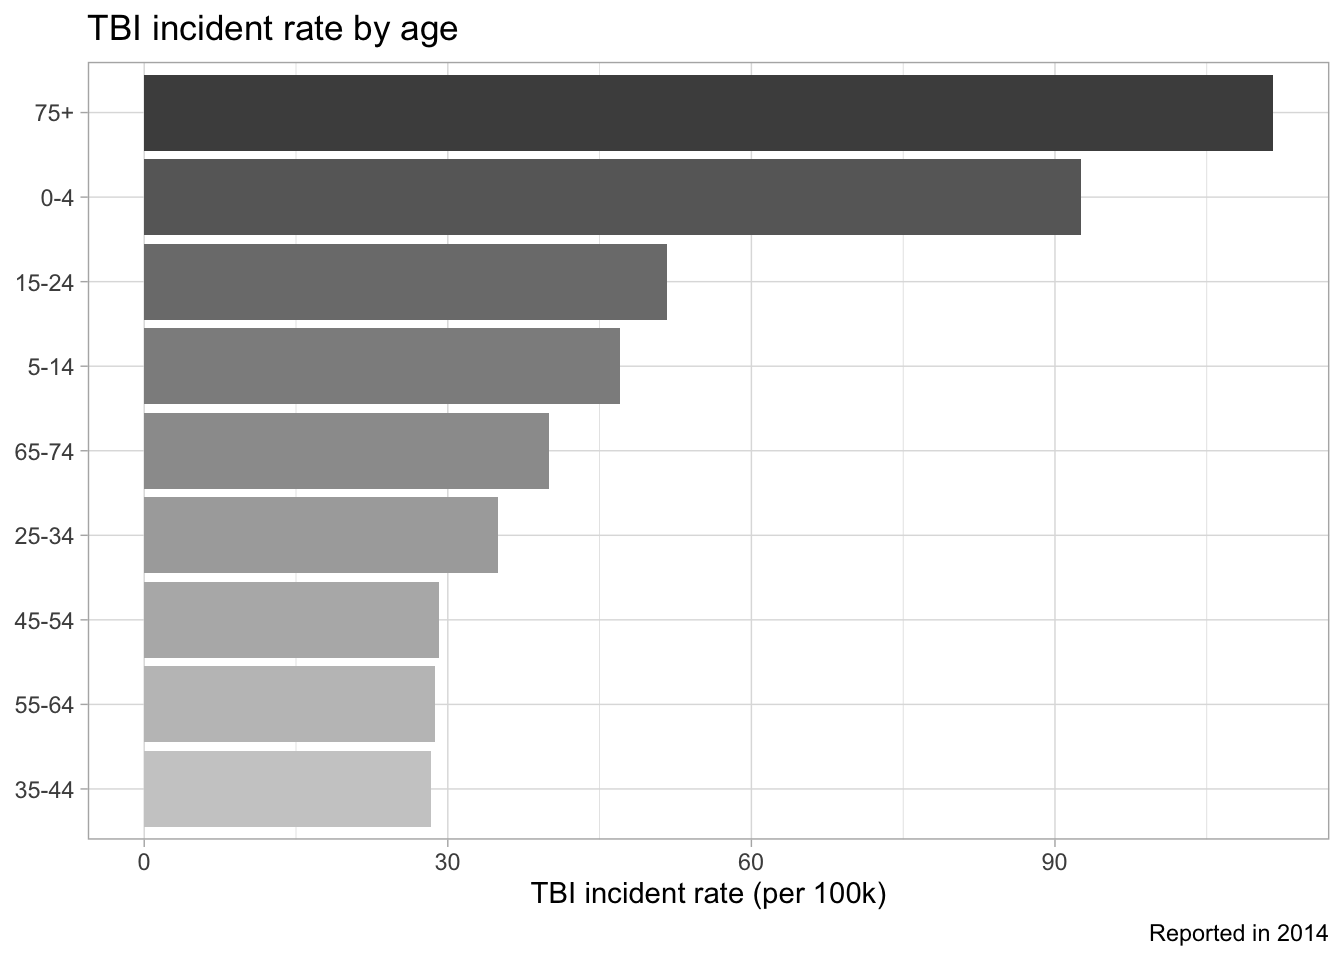
tbi_age %>%
  group_by(injury_mechanism) %>%
  summarize(total = sum(number_est, na.rm = TRUE),
            rate = round(mean(rate_est, na.rm = TRUE), 2)) %>%
  kable() %>%
kable_styling(bootstrap_options = "striped", full_width = FALSE)| injury_mechanism | total | rate |
|---|---|---|
| Assault | 232748 | 20.74 |
| Intentional self-harm | 22321 | 3.28 |
| Motor Vehicle Crashes | 403529 | 38.01 |
| Other or no mechanism specified | 206984 | 23.93 |
| Other unintentional injury, mechanism unspecified | 189994 | 19.51 |
| Unintentional Falls | 1380082 | 189.19 |
| Unintentionally struck by or against an object | 441415 | 46.07 |
tbi_age %>%
  group_by(age_group, injury_mechanism) %>%
  summarize(rate = round(mean(rate_est, na.rm = TRUE), 2)) %>%
  ungroup() %>%
  mutate(reorder_within(age_group, rate, injury_mechanism)) %>%
  ggplot(aes(age_group, rate, fill = injury_mechanism)) +
  geom_col(position = "dodge") +
  coord_flip() +
  labs(title = "TBI incident rate by age",
       caption = "Reported in 2014",
       x = NULL,
       y = "TBI incident rate (per 100k)")
tbi_age %>%
  group_by(age_group, injury_mechanism) %>%
  summarize(rate = round(mean(rate_est, na.rm = TRUE), 2)) %>%
  ungroup() %>%
  mutate(age_group = fct_relevel(age_group, age_levels),
         `Injury Mechanism` = injury_mechanism) %>%
  ggplot(aes(age_group, rate, color = `Injury Mechanism`)) +
  geom_point() +
  geom_line(aes(group = `Injury Mechanism`), size = 1.25) +
  labs(title = "Rate of injuries according to age",
       caption = "Reported for year 2014",
       x = "Age Range",
       y = "TBI Rate (Log Scale)") +
  scale_y_log10() +
  scale_color_brewer(palette = "Dark2") +
  guides(color = guide_legend(reverse = TRUE))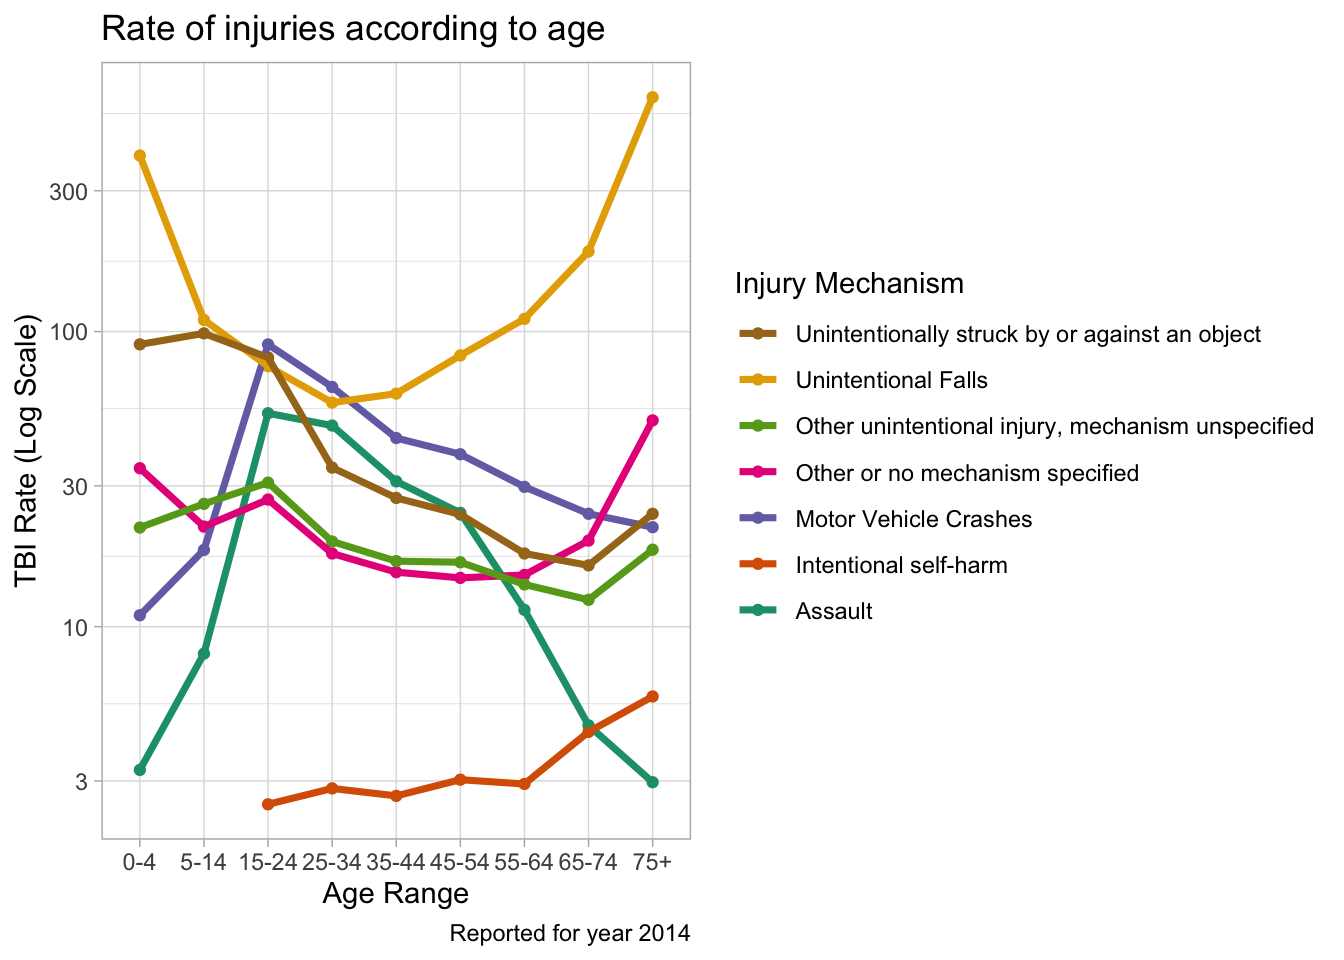
Setup Script for this Rmarkdown document:
knitr::opts_chunk$set(echo = TRUE)
knitr::opts_chunk$set(message = FALSE)
knitr::opts_chunk$set(warning = FALSE)

library(tidyverse)
library(scales)
library(stringr)
library(tidyr)
library(lubridate)
library(patchwork)
library(kableExtra)
library(tidytext)

ggplot2::theme_set(theme_light())

# Function to add colored text to the document

colorize <- function(x, color) {
  if (knitr::is_latex_output()) {
    sprintf("\\textcolor{%s}{%s}", color, x)
  } else if (knitr::is_html_output()) {
    sprintf("<span style='color: %s;'>%s</span>", color,
      x)
  } else x
}
Andrew G Farina
Academy Professor
My research interests include leadership (risk-taking propensity | appraisal) and character (intentional self-regulation) development.